Deriv has made market analysis very easy for traders by providing a TradingView chart page where anyone can analyze Deriv tradable assets before placing trades. With Deriv Trading View, you don’t need MT5 or any extra software. You can study the market, add indicators, draw levels, and plan your trade properly. In this article we will explain how to analyze Deriv markets on TradingView.com.
Learn trading the smart way on Deriv by analyzing the market first and trading with a clear plan.
What Is Deriv Trading View?
Deriv Trading View is the TradingView-powered chart system provided by Deriv on Tradingview.com.
On this page, traders can:
- Analyze all Deriv tradable assets
- Switch between timeframes
- Add indicators
- Draw support and resistance
- Study price movement before trading
It works directly on your browser and supports:
- Synthetic indices
- Forex pairs
- Crypto
- Commodities
How to Access Deriv Trading View
To analyze the market:
- Visit https://charts.deriv.com/deriv
- Select the asset you want to analyze
- Choose your timeframe
- Add indicators or draw on the chart
You don’t need to log in to start analyzing.
Understanding the Deriv Trading View Chart
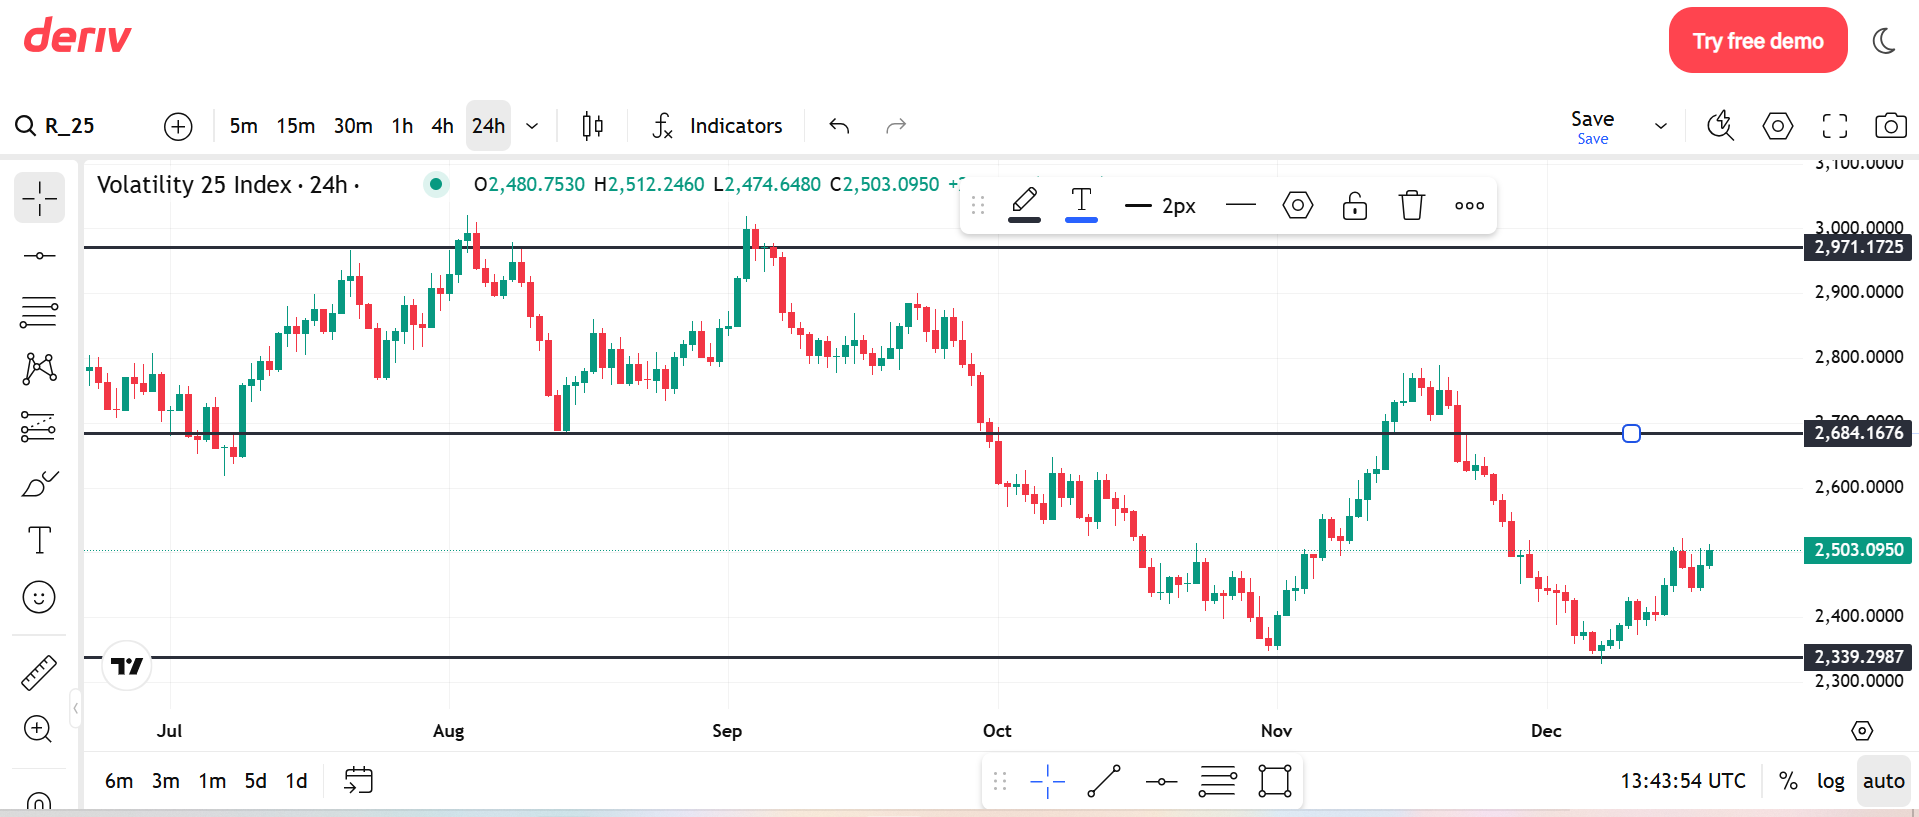
When you open the page, you’ll see a clean TradingView chart like the one in the screenshot below

1. Market Selection (Top Left)
At the top left, you can search and select any Deriv asset.
Examples:
- Volatility 25 Index
- Boom & Crash indices
- Forex pairs like EUR/USD
- Crypto assets
This allows you to analyze any Deriv tradable market before trading.
2. Timeframe Selection
Just beside the asset name, you’ll see timeframes like:
- 5m
- 15m
- 30m
- 1h
- 4h
- 24h
How to use timeframes properly:
- Higher timeframe (1h – 24h): Find direction
- Lower timeframe (5m – 15m): Find entry
Never analyze only one timeframe.
3. Candlestick Chart (Price Movement)
The chart uses candlesticks:
- Green candle → price moved up
- Red candle → price moved down
Long candles mean strong movement.
Small candles mean weak or slow market.
This helps you understand market strength.
How to Identify Trend on Deriv Trading View
Trend tells you where the market is heading.
Uptrend:
- Price keeps making higher highs
- Price keeps making higher lows
Downtrend:
- Lower highs
- Lower lows
Sideways market:
-
Price moving between two levels
Simple rule:
Trade in the direction of the trend.
How to Draw Support and Resistance on Deriv Trading View
Support and resistance are one of the most important tools for Deriv analysis.
From the screenshot above, you can see horizontal lines drawn on the chart.
Support:
- Area where price stops falling
- Buyers enter here
Resistance:
- Area where price stops rising
- Sellers enter here
How to draw them:
Look for areas price touched many times
- Draw zones, not thin lines
- Use higher timeframe levels
This works very well for synthetic indices.
Using Indicators on Deriv Trading View
On the top menu, click Indicators to add tools.
Keep your chart simple.
Best indicators to use:
- Moving Average – shows trend
- RSI – shows overbought or oversold areas
- Bollinger Bands – shows volatility and breakouts
Too many indicators will confuse you.
Analyzing Synthetic Indices on Deriv Trading View
Synthetic indices behave differently from forex.
Important things to note:
- No news affects them
- Movement is continuous
- Volatility can be fast
How to analyze properly:
- Use higher timeframe direction
- Trade from support or resistance
- Avoid chasing sudden spikes
For Volatility indices, trend analysis works best.
For Boom & Crash, patience is key.
Multi-Timeframe Analysis (Very Important)
Good traders don’t enter blindly.
Example:
- 24h chart → overall direction
- h1 or h4 chart → setup area
- 5m chart → entry point
This helps you avoid bad trades.
Using Alerts on Deriv Trading View
You can set alerts on:
- Key price levels
- Support or resistance
- Indicator signals
Alerts help you avoid watching the chart all day.
Common Mistakes Traders Make
Avoid these mistakes:
- Trading without analysis
- Using too many indicators
- Ignoring higher timeframe
- No stop loss
- Overtrading synthetic indices
Simple analysis works better than complex systems.
Risk Disclaimer
Deriv offers complex derivatives, such as options and contracts for difference (“CFDs”). These products may not be suitable for all clients, and trading them puts you at risk. Please make sure that you understand the following risks before trading Deriv products: a) you may lose some or all of the money you invest in the trade, b) if your trade involves currency conversion, exchange rates will affect your profit and loss. You should never trade with borrowed money or with money that you cannot afford to lose.