


Price Action is one of the most powerful trading strategies because it focuses purely on price movement without relying heavily on indicators. Instead of crowding your chart with tools, you learn to read candlesticks, patterns, and key levels to anticipate where the market is heading.
Learn the Secret of Forex Trading, Click here to download a free e-book now
Whether you’re a beginner or an advanced trader, Price Action can help you simplify your trading decisions and boost consistency.
Key Summary
Price Action is about simplicity and clarity. It helps traders understand the market without overcomplicating charts. By mastering candlestick patterns, support/resistance, and trends, you can enter trades with confidence and precision.
What is Price Action Trading?
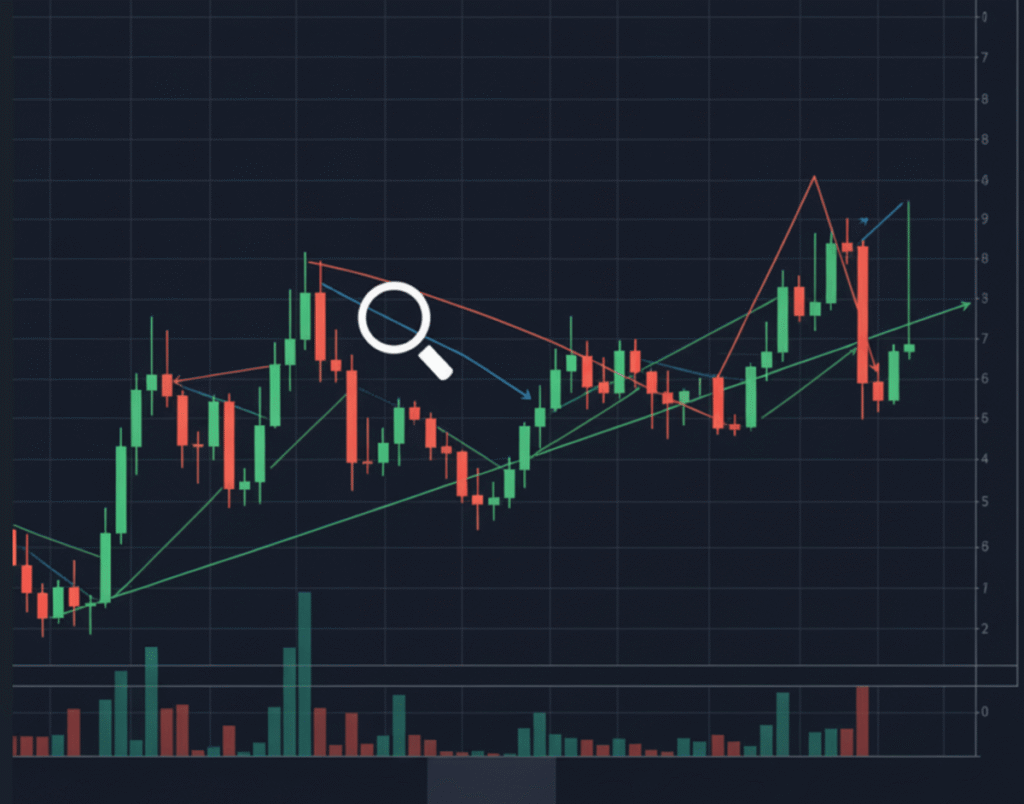
Price Action is the study of market movement through candlestick patterns, support and resistance levels, and trend structures. It’s about observing “what price is doing now” rather than predicting with complicated indicators.
For example:
- A bullish engulfing candle near support may suggest a potential upward reversal.
- A pin bar rejecting resistance often signals selling pressure.
Why Traders Love Price Action
- Simplicity – No clutter, just the chart and price movement.
- Flexibility – Works across forex, stocks, crypto, and commodities.
- Clarity – Helps traders spot market sentiment and direction quickly.
- Precision – Offers cleaner entries and exits at important levels.
Quick Price Action Trading Checklist:
| Element | What to Look For | Trading Insight |
|---|---|---|
| Trend Direction | Higher highs & higher lows (uptrend), lower highs & lower lows (downtrend) | Trade in the direction of the trend for higher probability setups. |
| Support & Resistance | Price rejection or multiple touches at key zones | Use these levels for entries, exits, and stop placement. |
| Candlestick Patterns | Pin Bar, Engulfing Candle, Doji | Signals possible reversal or continuation. |
| Breakouts | Strong close above resistance or below support | Entry opportunity with momentum confirmation. |
| Pullbacks | Small retracements within a trend | Enter at better price with lower risk. |
| Trendlines | Price bouncing off upward/downward diagonal lines | Confirms strength of the trend and offers entry points. |
| Market Sentiment | Long wicks, strong bullish/bearish closes | Shows who (buyers/sellers) is in control. |
| Volume (optional) | Rising volume during breakouts | Confirms breakout strength (useful even without indicators). |
Key Price Action Strategies
1. Support and Resistance
Support is where price tends to stop falling, while resistance is where price often stops rising. These levels act like floors and ceilings in the market.
How to use them:
- Buy near strong support in an uptrend.
- Sell near strong resistance in a downtrend.
- Watch for breakouts—if price breaks through resistance, that level often becomes new support (and vice versa).
Example: If EUR/USD has bounced three times from 1.0500, it’s a strong support. A bullish candlestick at that level could be your entry signal.
2. Candlestick Patterns
Candlestick formations are like the market’s language. They tell you what buyers and sellers are thinking.
Key patterns to know:
- Pin Bar: Long wick with small body → strong rejection (good reversal signal).
- Engulfing Candle: Big candle completely covers the previous one → shows a power shift between buyers and sellers.
- Doji: Small body, equal wicks → indecision, often before a big move.
Example: A bullish engulfing candle at support means buyers are stepping in strongly—potential buy setup.
3. Trendline Trading
Trendlines help you see the market direction more clearly. Draw them along higher lows in an uptrend or lower highs in a downtrend.
How to use them:
- Enter when price touches and bounces off a trendline.
- Combine with candlestick patterns for confirmation.
- If a trendline breaks, it could signal a trend reversal.
Example: In GBP/JPY, a clear upward trendline forms. Price bounces at the line three times. On the fourth bounce, you enter long with stop just below the line.
4. Breakouts
Breakouts happen when price escapes from a range or key level. They often lead to explosive moves.
How to use them:
- Identify strong consolidation zones (sideways markets).
- Wait for a strong candle to break above resistance or below support.
- Look for volume increase or retest of the broken level for confirmation.
Example: USD/JPY is stuck between 148.00 and 149.00. When a strong bullish candle closes above 149.00, that’s a breakout signal. Enter long and ride the move.
5. Pullbacks
Even in strong trends, the market doesn’t move straight—it pulls back before continuing. These dips are golden opportunities.
How to use them:
- Identify the main trend on a higher timeframe.
- Wait for price to pull back to a support/resistance zone, moving average, or Fibonacci retracement.
- Enter when confirmation appears (like a bullish candle in an uptrend).
Example: In a EUR/USD uptrend, price pulls back to the 50% Fibonacci level and forms a pin bar. That’s your entry signal to buy the continuation.
How to Trade with Price Action (Step by Step)
- Identify the market trend.
- Mark key support and resistance zones.
- Watch for candlestick patterns or breakouts.
- Enter trades with confirmation (not just one candle).
- Place stop-loss beyond the pattern or key level.
- Ride the trade until price nears the next level.
FAQ on Price Action Trading
Q1: Does Price Action work in all markets?
Yes, it works on forex, stocks, crypto, and commodities.
Q2: Do I need indicators for Price Action?
No, but you can combine simple tools like moving averages for extra confirmation.
Q3: What timeframe is best for Price Action?
It depends on your style—scalpers use 1M-15M, swing traders prefer 1H-4H, and position traders look at daily/weekly charts.
Q4: Is Price Action good for beginners?
Yes, it’s beginner-friendly since it teaches you to focus on what matters most—price itself.