In this guide, we are going to look at Forex playbook for beginners. As a three-time Italian Forex Trading Champion (2013, 2014 and 2015), I will be sharing a repeated trading process that can help you trade Forex confidently.
Build your trading process before risking real money, Click here to Create a free demo account now.
When I first started trading, I was immediately drawn to algorithmic analysis. Indicators and oscillators caught my attention because of a very simple idea: financial markets are complex, but perhaps some of that complexity can be translated into objective information through mathematical tools such as RSI, Stochastic, MACD, DeMarker and many others.
Over the years, I studied the formulas behind most of these major technical indicators available to traders. Eventually, however, I did what I believe every trader should do: I simplified. Instead of trying to use everything, I selected a small number of tools that help me answer three fundamental questions:
- What is volatility doing?
- What is momentum doing?
- What is the trend?
In my experience, if a trader can develop a good understanding of these three elements, technically he already has a very solid foundation. The purpose of this forex playbook for beginners is therefore not to give beginners ten different strategies. It is exactly the opposite.
I want to show you how I structure one trading process that can be observed, tested, practised on demo and repeated. This is an educational framework, not a guarantee of profitability or a recommendation to buy or sell any financial instrument.
Forex Playbook for Beginners
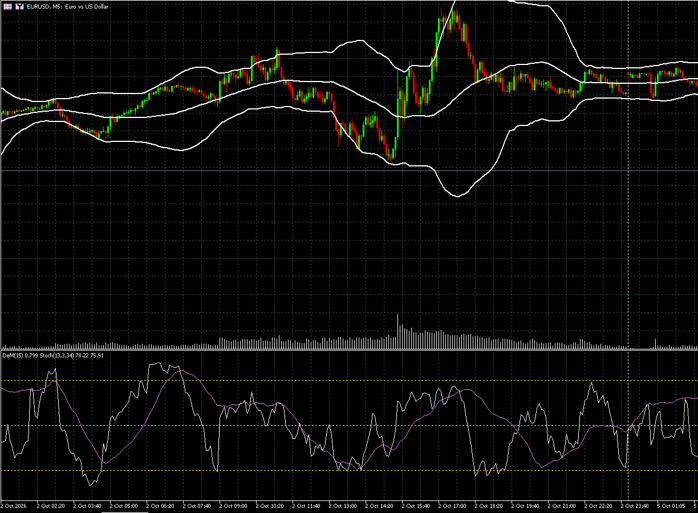
Volatility: Bollinger Bands
The first component of my chart is volatility. I use Bollinger Bands based on:
- 50-period Simple Moving Average
- 2.25 standard deviations
The classic Bollinger Bands configuration is 20 periods and 2 standard deviations. John Bollinger had discussed adjusting the standard deviation multiplier when changing the moving average length; for a 50 period average, his commonly cited guideline is approximately 2.1 standard deviations. My 50 / 2.25 configuration is a personal calibration that I prefer after years of observation and testing.
Why do I use a longer period?
In my experience, the 50 period structure produces smoother volatility cycles and helps me read expansion and compression more clearly, especially on lower intraday timeframes. I also pay attention to BandWidth, essentially the distance between the Upper and Lower Bollinger Bands.
I do not treat BandWidth as a prediction of the future. Instead, I use it as a practical measurement of the market’s current volatility environment. A narrow band tells me volatility has contracted. A wider band tells me volatility has expanded.
This context becomes especially valuable when combined with momentum and trend.
Another important point for beginners: touching or exceeding a Bollinger Band is not automatically a reversal signal. Strong trends can remain near or outside one band for a considerable period.
That is why Bollinger Bands are only one component of my process.
Momentum: DeMarker and Stochastic
After years of research, I eventually selected two oscillators for momentum analysis.
DeMarker
In this Forex playbook for beginners, let me tell you my first oscillator is DeMarker. Tom DeMark, the creator of the DeMarker indicator, is one of the most respected figures in algorithmic trading. His approach is rigorous, based on extensive research, and designed to make the trading process as objective as possible. I also had the opportunity to meet him during a conference held at the Milan Stock Exchange, where I was able to appreciate firsthand both his expertise and his passion for the markets.Its basic calculation compares the current bar’s highs and lows with those of the previous bar:
- DeMax = max(Current High − Previous High, 0) DeMin = max(Previous Low − Current Low, 0) and:
- DeMarker = SMA(DeMax) / [SMA(DeMax) + SMA(DeMin)]
This produces an oscillator between 0 and 1.
My settings are:
- Period: 15
- Oversold: 0.20
- Overbought: 0.80
The commonly used MetaTrader thresholds are 0.30 and 0.70, so my 0.20/0.80 levels are deliberately more selective. I mainly use DeMarker for identifying regular and hidden divergences and for improving entry timing. I consider it an early-warning tool rather than a trading signal by itself.
A divergence tells me momentum may be changing. It does not tell me that price must reverse. That distinction is fundamental.
Stochastic Oscillator
My second momentum tool is the Stochastic Oscillator. In simplified form:
%K = 100 × (Close − Lowest Low) / (Highest High − Lowest Low)
calculated over a specified number of periods. MetaTrader then allows additional smoothing of %K and calculates %D as a moving average of %K. MQL5
My configuration is:
- %K period: 13
- %D period: 3
- Slowing: 34
- Oversold: 20
- Overbought: 80
I do not use the %D line to generate my trading signals. For me, Stochastic has a different role from DeMarker. I use it almost as a cyclical manager. Because of the heavier smoothing in my configuration, I use it to identify broader swings and situations where buying or selling pressure has become extended.
So DeMarker helps me with shorter-term momentum and divergence, while Stochastic helps me understand the wider momentum cycle
Trend: Start with Relative Currency Strength
This is perhaps the most important element of the entire process. Even for an intraday trader, trend matters. Markets are fractal. I may execute trades on a five-minute chart, but that five-minute chart exists inside larger structures.
And when a genuine directional trend is present, price will generally spend more time and travel more distance in the direction of that trend than against it.
Forex gives us a particularly interesting advantage: we can compare currencies against each other. Instead of opening EUR/USD and immediately asking, “Should I buy or sell EUR/USD?”, I prefer to start one step earlier.
I ask: Which currencies are strong today? Which currencies are weak? I personally execute primarily on M5, but I monitor relative currency strength on: M15 H1 H4. I then try to combine currencies where there is a meaningful strength differential.
If USD is consistently strong across the timeframes I monitor while EUR is weak, for example, EUR/USD naturally becomes more interesting to me from the short side. This does not mean I immediately sell it. It means I have identified where I want to look for a setup.
Relative-strength indicators can be found for MetaTrader, although traders should remember that currency-strength calculations are not universally standardized. Whatever tool you choose, use the same methodology consistently rather than switching between different strength models whenever the result does not suit you.
The Confirmation Candle
Once volatility, momentum and relative strength are aligned, I still want price itself to confirm my idea. That is where candlestick analysis comes in. For a LONG setup, I want:
- Close > Open
- Candle Range > SMA(100) of ATR(14)
- Close positioned as close as possible to the candle high For a SHORT setup, I want:
- Close < Open
- Candle Range > SMA(100) of ATR(14)
- Close positioned as close as possible to the candle low Why compare the candle with an ATR-based volatility baseline?
I display ATR(14) together with a 100-period moving average of that ATR to understand what can be considered normal volatility for the instrument I am trading. I want my setup candle to show above-average expansion.
In my historical observations on low timeframes such as M5, very small setup candles have often contained much less useful information and behaved more like market noise. One important clarification: in my own discretionary trading, I can visually assess whether a candle closes “close enough” to its high or low.
A beginner who wants a truly repeatable and back-testable system should go one step further and define that requirement numerically.
That is an important lesson: If a rule cannot be defined, it cannot be tested objectively.
Ready to put the playbook to work? Start with a free demo account and test the strategy with virtual funds
Putting Everything Together: A EUR/USD Example
Let us now combine the pieces.
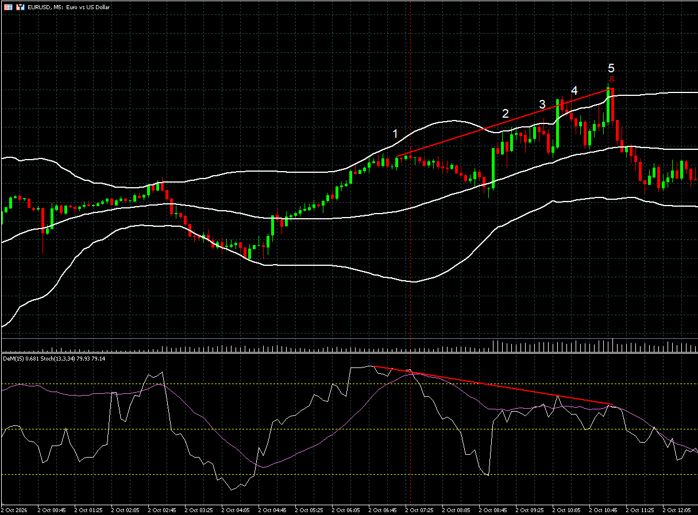
In a recent EUR/USD example, both DeMarker and Stochastic moved into their overbought zones. Price was also trading above the Upper Bollinger Band. Again, this alone was not a short signal. Price outside a Bollinger Band can also indicate strength.
What made the situation interesting was the combination of factors. Momentum was extended, potential bearish divergences were developing, and USD ranked among the stronger major currencies in my multi-timeframe relative-strength analysis.
Several potential reversal points appeared, but the candles did not have sufficient range for me to consider them meaningful confirmations.
Then came the candle I was waiting for. A strong bearish candle appeared with:
- wide range
- close near the low
- clear rejection of the previous bullish move
In the example described, the bearish candle completely engulfed the body of the previous bullish candle. Technically, this is best classified as a Bearish Engulfing pattern
Now I had the complete sequence:
- Relative strength → direction
- Bollinger Bands → volatility context
- DeMarker + Stochastic → momentum condition Price action → execution confirmation
That is the setup.
Notice what I am not doing. I am not selling simply because Stochastic is overbought. I am not selling simply because price touches a Bollinger Band. I am not selling simply because USD is strong. I am looking for several independent pieces of information to tell a coherent story.
One Risk Rule
Once you have a setup, risk becomes more important than the setup itself. Daniel Kahneman’s work on decision-making under uncertainty showed how differently human beings perceive probabilities, gains and losses. Our response to financial risk is therefore not purely mathematical; psychology matters enormously.
During more than 20 years in markets and while training hundreds of traders, I have seen this repeatedly. A position size that feels perfectly normal to one trader can create enormous emotional pressure for another.
My recommendation to beginners is therefore simple: Start small. Very small.
Then use a fixed-fractional risk model.
This means selecting a small percentage of your current account equity and risking that same percentage on every trade. If the account grows, monetary risk gradually increases. If the account falls, monetary risk automatically decreases.
This has an important characteristic: during a drawdown, the absolute amount of money you are risking becomes progressively smaller instead of larger. For beginners, the exact percentage is less important than consistency and survival.
Choose a level small enough that one losing trade does not change your emotional state or tempt you to abandon your process.
Keep a trading journal.
Record not only the trade, but also what you felt before, during and after it. If you feel excessive pressure, the solution is usually not to become “more courageous”. It is to reduce the risk.
Test the Process Before Trading Live
This is where a platform such as Deriv fits naturally into the process. Deriv offers an MT5 demo environment where traders can practise with virtual funds, access Forex markets and use the MT5 charting and analytical environment without risking real capital.
For a beginner, I would use the demo account with a very specific objective. Not to “make fake money”. Not to see how much the account can grow in a week. The objective is to determine whether you can execute the same process consistently.
- Build the chart.
- Monitor relative strength.
- Wait for your momentum condition. Wait for the candle confirmation.
- Define the stop before entering.
- Calculate the position size from your fixed risk rule. Record the trade.
- Then do it again. And again.
If you later convert the rules into an automated strategy, MT5 also provides an environment for systematic strategy testing. But even before automation, a demo account is extremely valuable for learning how the process behaves under changing market conditions.
The Real Forex Playbook for Beginners
After training more than 300 traders, one of the most common mistakes I have seen is the constant search for something new.
- A new indicator. A new strategy.
- A new YouTube video.
- A new secret entry technique.
The beginner accumulates information but never builds experience with any single process. I believe the opposite approach is more productive.
- Define the setup.
- Define the risk.
- Apply the same money-management model.
- Record the results.
- Review them.
- Repeat.
That is the playbook. A successful trader does not need to predict every market movement. A trader needs a process that is clear enough to follow, simple enough to repeat and objective enough to evaluate.
- Build it.
- Test it on demo.
- Collect enough observations to understand its strengths and weaknesses.
- Gain confidence from evidence rather than hope.
Then, and only then, consider moving gradually toward real-money execution. There is no shortcut around the process.