Trading Volatility 100 (1s) is exciting because the market moves continuously and delivers frequent opportunities. But that same speed is exactly why many new traders lose money quickly. After years of studying trader behavior, one pattern appears repeatedly: beginners focus too much on entries and not enough on market context. This guide will teach you how to trade Volatility 100 (1s) using Multi-Timeframe Analysis (MTFA)—a structured approach that helps traders understand the bigger picture before entering a position.
Learn the Secret of Forex Trading, Click here to download a free e-book now
If you are new to synthetic indices, this article is designed to help you build discipline before you chase profits.
What Is Volatility 100 (1s)?
Volatility 100 (1s) is a synthetic index designed to simulate markets with constant 100% volatility and a tick generated every second.
Unlike traditional forex markets:
- It runs continuously
- There are no economic news events
- Price movement is algorithmically generated
- Momentum and structure become extremely important
Because of its speed, many traders enter randomly and overtrade. The solution is learning to trade with context.
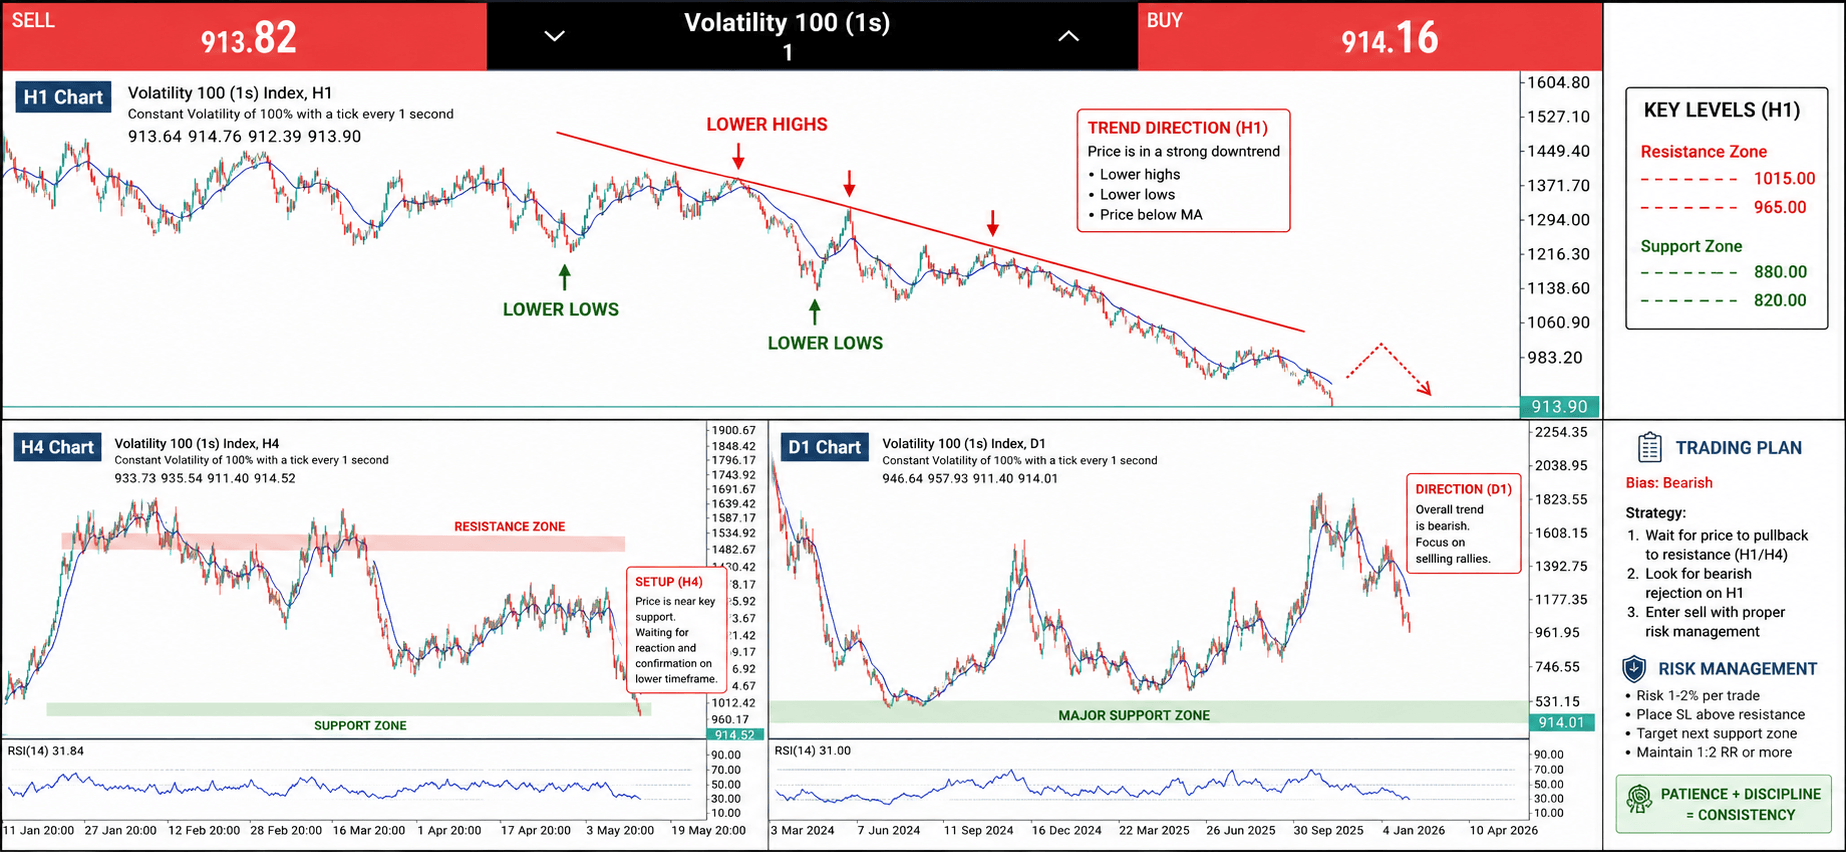
How to Trade Volatility 100 (1s): Using Multi-Timeframe Analysis
Multi-Timeframe Analysis (MTFA) means using multiple chart timeframes to make one decision.
Instead of asking:
“Should I buy now?”
You ask:
- What is the overall trend?
- Is momentum supporting it?
- Where is the safest entry?
For Volatility 100 (1s), this article uses:
- D1 (Daily) → Direction
- H4 (4 Hours) → Setup
- H1 (1 Hour) → Entry
Think of it like this:
| Timeframe | Purpose |
|---|---|
| D1 | Where price is likely heading |
| H4 | Where opportunities are forming |
| H1 | Where execution happens |
Step 1: Start With D1 (Daily) — Find Direction
The daily chart should answer one question:
Who is in control? Buyers or sellers?
Look for:
Bearish Market
- Lower highs
- Lower lows
- Price below moving average
Bullish Market
- Higher highs
- Higher lows
- Price above moving average
Note:
- Oversold does not automatically mean buy.
- Many traders lose money buying simply because RSI reaches 30.
- RSI can remain oversold while price keeps falling.
- Your job is to observe—not predict.
Step 2: Move to H4 — Build the Trading Scenario
Once direction is identified, move to H4.
Ask:
If Daily Is Bearish:
- Is H4 creating pullbacks?
- Is momentum slowing?
- Is price respecting resistance?
If Daily Is Bullish:
- Are dips being bought?
- Are higher lows forming?
On Volatility 100 (1s), H4 often removes noise and reveals cleaner momentum. You are not entering yet. You are preparing.
Step 3: Use H1 for Precision Entries
This is where beginners usually start. That is the mistake.
Use H1 only after D1 and H4 align.
Entry checklist:
Trend identified on D1
Setup confirmed on H4
Entry trigger appears on H1
Examples of entry triggers:
Sell Setup
- Lower high forms
- Moving average rejection
- Bearish candle confirmation
Buy Setup
- Higher low forms
- Break and retest
- Bullish momentum candle
A Simple Volatility 100 (1s) Trading Framework
SELL Example
Daily → Bearish
↓
H4 → Pullback into resistance
↓
H1 → Bearish rejection
↓
Entry → Sell
Stop Loss:
Above recent swing high
Take Profit:
Minimum 1:2 risk-reward
BUY Example
Daily → Bullish
↓
H4 → Support holding
↓
H1 → Momentum confirmation
↓
Entry → Buy
Stop Loss:
Below recent swing low
Take Profit:
Next structure level
Risk Management Rules Every Beginner Should Follow
No strategy survives poor risk management.
Follow these rules:
- Risk 1–2% Per Trade.
- One Setup at a Time: Do not open multiple random positions.
- Accept Losses: Losses are business expenses.
- Journal Every Trade
Common Mistakes New Volatility 100 (1s) Traders Make
1. Trading H1 Without Context
Small timeframe signals fail often.
2. Buying Every Oversold RSI
Oversold is not reversal.
3. Increasing Lot Size After Losses
This destroys accounts.
4. No Stop Loss
Every trade needs a defined risk.
5. Switching Strategies Weekly
Master one approach.
A 30-Day Learning Plan for Beginners
Week 1
Study chart structure only.
Week 2
Practice D1 → H4 → H1 analysis.
Week 3
Trade demo with fixed rules.
Week 4
Review journal and improve.
Goal:
Not profit.
Goal:
Consistency.
Ready to begin, click here to Open a free Volatility 100 (1s) account now
Final Thoughts
Volatility 100 (1s) rewards patience more than prediction. The strongest traders are rarely the ones taking the most trades—they are usually the ones waiting for alignment across multiple timeframes.
When D1 gives direction, H4 gives context, and H1 gives entry, decision-making becomes calmer and more disciplined.
If you are beginning your journey, focus first on becoming a structured trader before becoming a profitable trader.
Frequently Asked Questions (FAQ)
Is Volatility 100 (1s) good for beginners?
Yes, but only if approached with proper risk management and structured analysis.
Which timeframe is best for Volatility 100 (1s)?
There is no single best timeframe. Combining D1, H4, and H1 creates stronger context.
Is RSI enough to trade Volatility 100 (1s)?
No. RSI should support decisions, not create them.
How much should beginners risk?
Many traders start with 1–2% risk per trad