


If you’ve traded the Forex market for any length of time, you’ve probably heard traders talk about volume. Some use it to confirm breakouts, others to catch reversals, and many rely on it to judge market strength. But here’s the truth: volume in Forex is not the same as volume in stocks or crypto. This often confuses beginners and even experienced traders who switch asset classes. In this guide, we’ll break down everything you need to know about volume in Forex, how it works, why it matters, and the tools you can use to spot better trades.
Learn the Secret of Forex Trading, Click here to download a free e-book now
Key Summary
- Forex doesn’t use real volume but relies on tick volume.
- Volume confirms trends, reveals reversals, and filters fake breakouts.
- The best indicators include OBV, A/D, MFI, and VWAP.
- Combine volume with price action for better accuracy.
- Don’t rely on volume alone — context is everything.
1. What is Volume in Forex?
In simple terms, volume measures how much trading activity is happening at a given time.
- In stocks or crypto, exchanges record the exact number of contracts or coins traded. This is called real volume.
- In Forex, there’s no central exchange, so brokers use something different: tick volume.
Tick volume represents how many times the price changes in a given period. The logic is simple — if price ticks are happening rapidly, trading activity is high.
So, while Forex doesn’t have “real” volume, tick volume is a very reliable proxy. In fact, studies comparing tick volume with actual transaction data from futures markets show a 90%+ correlation.
2. Why Volume Matters for Traders
So why should you care about volume if it isn’t real? Because it’s one of the best ways to confirm whether price movements have strength behind them.
Here’s what volume in Forex tells you:
- Market participation: High volume means a lot of traders are active, adding weight to the move.
- Trend confirmation: If price moves up and volume is rising, the trend is strong.
- Spotting reversals: If price keeps climbing but volume is falling, momentum may be weakening.
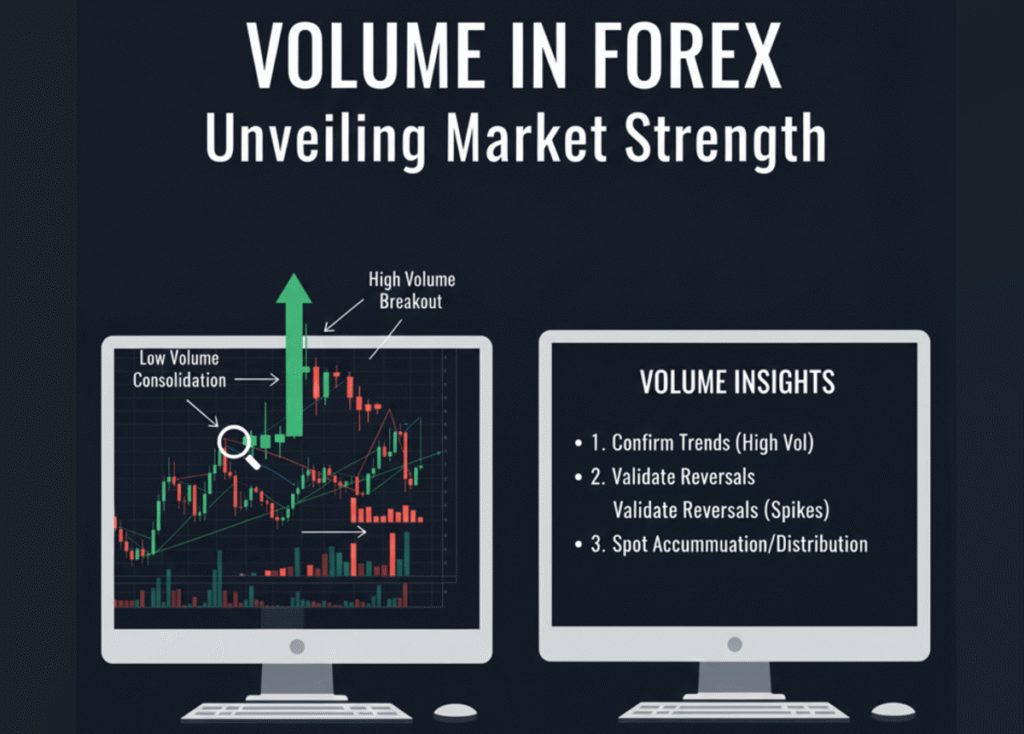
- Avoiding false breakouts: Breakouts with low volume often fail, while those with strong volume are more likely to continue.
Think of volume as the “fuel” behind price. No fuel? The move won’t last.
3. How to Read Volume in Forex Charts
- Reading volume isn’t rocket science — it’s about context.
- Rising price + rising volume = Strong trend continuation.
- Rising price + falling volume = Possible exhaustion.
- Falling price + rising volume = Strong bearish momentum.
- Breakout + high volume = Genuine move.
- Breakout + weak volume = Likely fakeout.
Example: Imagine EUR/USD is stuck between 1.0800 and 1.0850. Suddenly, price breaks above 1.0850. If volume spikes, that breakout is more likely to sustain. If volume is flat, it might just be a trap.
4. Key Volume Indicators in Forex
Most trading platforms (like MT4, MT5, and TradingView) give you tools to analyze volume. Here are the most common ones:
a) Volume Indicator (default)
Shows tick volume as a histogram under your chart. Simple but effective for spotting spikes.
b) On-Balance Volume (OBV)
Adds or subtracts volume based on price direction. If price closes higher, volume is added; if lower, it’s subtracted. This helps track buying/selling pressure.
c) Accumulation/Distribution (A/D) Line
Measures where price closes within a candle and weights it with volume. Helps spot divergence between price and participation.
d) Money Flow Index (MFI)
A combination of RSI + volume. Great for spotting overbought/oversold conditions with volume context.
e) VWAP (Volume Weighted Average Price)
More common in stocks but still useful in Forex. Shows the average price weighted by volume, often acting as dynamic support/resistance.
5. Combining Volume With Price Action
Volume is most powerful when used alongside price action.
- Support/Resistance: If price hits resistance but volume drops, breakout may fail. If volume spikes, breakout has more weight.
- Trendlines: A trendline bounce with rising volume shows continuation. A break with volume shows reversal.
- Candlestick Patterns: Pin bars, engulfing candles, and dojis mean more when volume confirms them.
Example: A bullish engulfing candle at support with high volume is far stronger than one with weak volume.
6. Common Mistakes Traders Make With Volume
Even though it’s simple, traders often misuse volume. Avoid these traps:
- Thinking tick volume is fake – It’s not perfect, but it works.
- Using volume alone – Always pair it with price action.
- Ignoring timeframes – Volume on M1 is noise; higher timeframes filter out the clutter.
- Overreacting to small spikes – Look for consistent patterns, not one-off moves.
Bottom Line
Volume may look simple, but it’s one of the most underrated tools in Forex trading. While it’s not the same as in stocks, volume in Forex still reveals the strength (or weakness) behind every move. If you learn to read it and combine it with solid price action, you’ll filter out bad trades, catch strong breakouts, and spot reversals before the crowd.
FAQ Section
Q1: Is Forex volume real?
No, it’s tick volume. But studies show a strong correlation with real volume from futures markets.
Q2: Which volume indicator is best for Forex?
OBV and Accumulation/Distribution are trader favorites, but even the default volume indicator works well.
Q3: Can volume predict reversals?
Not on its own, but falling volume during a trend is often an early warning of exhaustion.
Q4: Is tick volume reliable for intraday trading?
Yes, especially on higher timeframes like H1, H4, and Daily.