


Most people say Crash 300 is random. I used to think so too — until I stopped guessing and started tracking zones, volatility, and structure. In 2025 alone, I took 87 trades on Crash 300. I didn’t scalp blindly. I didn’t chase every candle. I studied the history, respected the zones, and followed the market behavior. The result – 89% win rate, $35,735 profit, majority of trades were Crash BUY, even in a long sell cycle. This article breaks down: What Crash 300 has done historically, Why volatility slowed down, What the current rally really means and how to trade Crash 300 intelligently, not emotionally.
Learn the Secret of Forex Trading, Click here to download a free e-book now
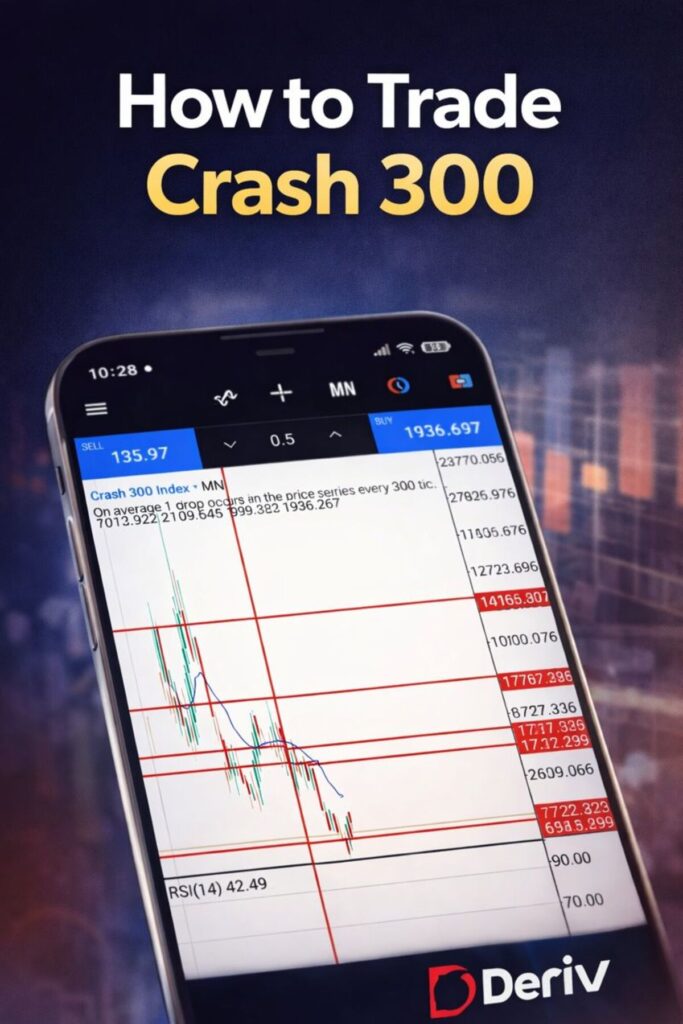
What Is Crash 300
Crash 300 is a synthetic index on Deriv, designed to simulate a market that:
- Rises gradually
- Crashes sharply
- On average, once every 300 ticks
It runs 24/7, has no news manipulation, and reacts purely to its internal algorithm. That makes it one of the best markets for data-based trading.
Crash 300 Historical Timeline (2021–2025)
Understanding how to trade Crash 300 starts with understanding where it’s coming from.
2021: Introduction
Introduced by Deriv around July 2021
- Started around the 10,130 zone
- Strong buy pressure followed
- Average daily movement: over 800 pips
- Price pushed aggressively to 22,500 zone
This was the most volatile phase of Crash 300
2022–2024: Distribution & Long Sell Cycle
- Major selling started from 22,500
- Market entered a prolonged sell trend
- Several buy rallies occurred, but none broke the long-term structure
One major rally:
- March 2024: Price pushed up to 7,722 zone
- Sell pressure resumed shortly after
This phase trapped many traders who kept buying without structure.
Late 2025: The Critical Bottom
- In November 2025, Crash 300 dropped below the 932 zone
- This was not just another low — it was a historical demand zone
- Volatility compressed heavily
Important shift:
- Before: 600–800 pips daily
- After sub-932: 200–350 pips daily
This slowdown confused many traders, but it actually signaled absorption, not weakness.
The Current Rally: What Changed?
The current buy rally:
- Started below 932 zone (Nov 2025)
- Climbed to 2030 zone by 31 Dec 2025
- Structure shows controlled higher highs
- Sell moves are acting as retracements, not trend reversals
Why Volatility Slowed Down (And Why It May Expand Again)
One mistake traders make when learning how to trade Crash 300 is assuming volatility is constant.
It’s not.
What the Data Shows
- High price zones historically = higher daily pips
- Deep low zones = compressed movement
- Below 932 zone, volatility slowed significantly
Some internal analysts believe:
If Crash 300 breaks and holds above key historical zones, daily pip movement could expand back to 500+ pips.
My 2025 Crash 300 Trading Stats
In 2025:
- 87 total trades
- 80% Crash BUY
- 20% Crash SELL
- 89% win rate
- $35,735 profit
- Risk per trade: ~$100
Why more buys?
Because even in a sell-heavy environment, retracements into structure are tradable if you understand zones.
How to Trade Crash 300
Understand Market Bias First
- Identify trend on H1 / H4
- Do not fight structure
Buy with caution at Retracements
- Look for sharp buy at historical demand zones
- Avoid buying at highs during expansion
Sell at Resistance (Don’t sell anyhow)
Only sell at:
- Major resistance
- Clear exhaustion point
-
I normally double up my lot size and positions when selling at high supply zone
Respect Volatility
During low-volatility phases:
- Take partial profits
- Don’t overtrade
When volatility expands:
-
Let winners run
This is how to trade Crash 300 without gambling.
Will Crash 300 Reach 7,722… or Even 22,500 Again?
That depends on:
Sustained buy pressure
How price reacts at intermediate zones
Volatility expansion
No market — synthetic or not — moves in a straight line.
But structurally, this rally is valid, not random.
Why Crash 300 Rewards Data, Not Emotions
Crash 300 punishes:
- Over-leverage
- Revenge trading
- Blind scalping
But it rewards:
- Patience
- Zone awareness
- Risk mangement
- Data-based decisions
Study the zones. Track volatility. Trade with intention — not hope.
Final Thought
Crash 300 is not easy. But it is readable. And once you understand its history, structure, and behavior, you stop asking “Is it random?” and start asking “Where is the next high-probability zone?”
That’s the difference between gambling and trading.
Risk Disclaimer
Deriv offers complex derivatives, such as options and contracts for difference (“CFDs”). These products may not be suitable for all clients, and trading them puts you at risk. Please make sure that you understand the following risks before trading Deriv products: a) you may lose some or all of the money you invest in the trade, b) if your trade involves currency conversion, exchange rates will affect your profit and loss. You should never trade with borrowed money or with money that you cannot afford to lose.